poster 0.6.0 released

I've just pushed poster 0.6.0 to the cheeseshop. Thanks again to everybody who sent in bug reports, and for letting me know how you're using poster! It's really great to hear from users. poster 0.6.0 fixes a few problems with 0.5, most notably:

  • Documentation updates to clarify some common use cases.
  • Added a poster.version attribute. Thanks to JP!
  • Fix for unicode filenames. Thanks to Zed Shaw.
  • Handle StringIO file objects. Thanks to Christophe Combelles.
poster 0.6.0 can be downloaded from the cheeseshop, or from my website. Documentation can be found at https://atlee.ca/software/poster/

What do you want to know about builds?

Mozilla has been quite involved in recent buildbot development, in particular, helping to make it scale across multiple machines. More on this in another post! Once deployed, these changes will give us the ability to give real time access to various information about our build queue: the list of jobs waiting to start, and which jobs are in progress. This should help other tools like Tinderboxpushlog show more accurate information. One limitation of the upstream work so far is that it only captures a very coarse level of detail about builds: start/end time, and result code is pretty much it. No further detail about the build is captured, like which slave it executed on, what properties it generated (which could include useful information like the URL to the generated binaries), etc. We've also been exporting a json dump of our build status for many months now. It's been useful for some analysis, but it also has limitations: the data is always at least 5 minutes old by the time you look, and in-progress builds are not represented at all. We're starting to look at ways of exporting all this detail in a way that's useful to more people. You want to get notified when your try builds are done? You want to look at which test suites are taking the most time? You want to determine how our build times change over time? You want to find out what the last all-green revision was on trunk? We want to make this data available, so anybody can write these tools.

Just how big is that firehose?

I think we have one of the largest buildbot setups out there and we generate a non-trivial amount of data:
  • 6-10 buildbot master processes generating updates, on different machines in 2 or 3 data centers
  • around 130 jobs per hour composed of 4,773 individual steps total per hour. That works out to about 1.4 updates per second that are generated

How you can help

This is where you come in. I can think of two main classes of interfaces we could set up: a query-type interface where you poll for information that you are interested in, and a notification system where you register a listener for certain types (or all!) events. What would be the best way for us to make this data available to you? Some kind of REST API? A message or event brokering system? pubsubhubbub? Is there some type of data or filtering that would be super helpful to you?

Two great, completely unrelated links

Yesterday was a bit of an overwhelming day. After getting home at 1am after a long bus ride home, I was unwinding by catching up on some news and email. I came across these two links, both of which really lifted my mood. The first, Grokking the Zen of the Vi Wu-Wei, talks about a programmer's journey from emacs to BBEdit to vim. This post is a great read in and of itself, but what's really worth it, is the link around the middle of the post to http://stackoverflow.com/questions/1218390/what-is-your-most-productive-shortcut-with-vim/1220118#1220118. This was truly a joy to read. Definitely the best answer I've ever seen on Stack Overflow, and quite possibly the best discussion of vi I've ever read. It taught me a lot, but I enjoyed reading it for more than that. It was almost like being on a little adventure, discovering all these little hidden secrets about the neighbourhood you've been living in for years. Like I said, it was 1am. The second, The Pope, the judge, the paedophile priest and The New York Times, gave me some reassurance that things aren't always as they seem as reported by the media. Regardless of how you feel about the Church or the Pope, it seems that journalistic integrity has fallen by the wayside here. From the article:

Fr Thomas Brundage, the former Archdiocese of Milwaukee Judicial Vicar who presided over the canonical criminal case of the Wisconsin child abuser Fr Lawrence Murphy, has broken his silence to give a devastating account of the scandal – and of the behaviour of The New York Times, which resurrected the story. It looks as if the media were in such a hurry to to blame the Pope for this wretched business that not one news organisation contacted Fr Brundage. As a result, crucial details were unreported.
The entire article is worth a read.

Buildbot performance and scaling

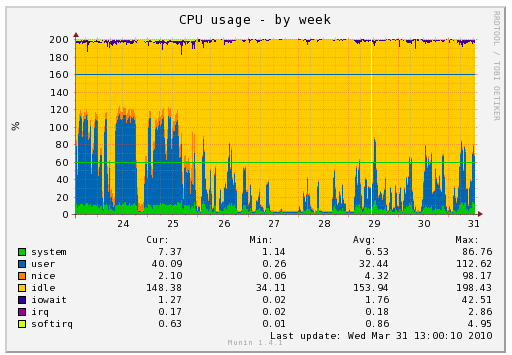
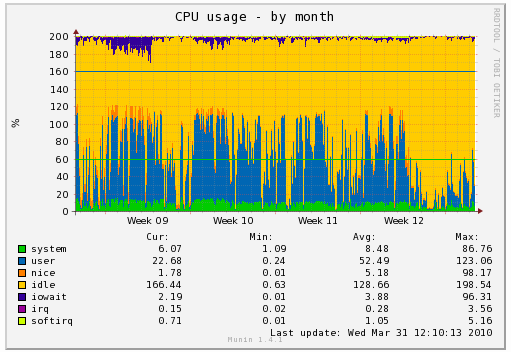
It seems like it was ages ago when I posted about profiling buildbot. One of the hot spots identified there was the dataReceived call. This has been sped up a little bit in recent versions of twisted, but our buildbot masters were still severely overloaded. It turns out that the buildbot slaves make a lot of RPC calls when sending log data, which results in tens of thousands of dataReceived calls. Multiply that by several dozen build slaves sending log data peaking at a combined throughput of 10 megabits/s and you've got an awful lot of data to handle. By adding a small slave-side buffer, the number of RPC calls to send log data is drastically reduced by an order of magnitude in some tests, resulting in a much better load situation on the master. This is good for us, because it means the masters are much more responsive, and it's good for everybody else because it means we have fewer failures and wasted time due to the master being too busy to handle everything. It also means we can throw more build slaves onto the masters! The new code was deployed towards the end of the day on the 26th, or the end of the 12th week.

BYO Build Dashboard

I'm happy to announce that we've started publishing some build data we've been collecting for the past several months. If you're interested in build data, like what jobs get run on which machines, and how long they take, then the files at http://build.mozilla.org/builds will be of interest to you. These are JSON dumps of build data collected for most of our systems since October. There is one file per 24-hour period, as well as one file for the past 4 hours of data. If you want to look at the format, the 4 hour file is easier to read; the other files don't use any extra white space. All times should be interpreted as unix timestamps (seconds since Jan 1, 1970 00:00:00 UTC). The "requesttime" is a best-effort calculation of when a build was requested based on when the revision in question was pushed to hg, or when the unit test or talos run was triggered. That's it! This should be enough data to get started writing some dashboards and other visualizations. I'd love to hear how people are using this data, and if there's anything missing from the data provided that would be useful.

Faster build machines, faster end-to-end time

One metric Release Engineering focuses on a lot is the time between a commit to the source tree and when all the builds and tests for that revision are completed. We call this our end-to-end time. Our approach to improving this time has been to identify the longest bits in the total end-to-end time, and to make them faster. One big chunk of the end-to-end time used to be wait times: how long a build or test waited for a machine to become free. We've addressed this by adding more build and test slaves into the pool. We've also focused on parallelizing the entire process, so instead of doing this: before we now do this: after(not exactly to scale, but you get the idea)

Faster builds please!

After splitting up tests and reducing wait times, the longest part of the entire process was now the actual build time. Last week we added 25 new machines to the pool of build slaves for windows. These new machines are real hardware machines (not VMs), with a quad-core 2.4 GHz processor, 4 GB RAM, and dedicated hard drives. We've been anticipating that the new build machines can crank out builds much faster. And they can. (the break in the graph is the time when mozilla-central was closed due to the PGO link failure bug) We started rolling the new builders into production on February 22nd (where the orange diamonds start on the graph). You can see the end-to-end time immediately start to drop. From February 1st to the 22nd, our average end-to-end time for win32 on mozilla-central was 4h09. Since the 22nd the average time has dropped down to 3h02. That's over an hour better on average, a 26% improvement. Faster builds means tests can start faster, which means tests can be done sooner, which means a better end-to-end time. It also means that build machines become free to do another build sooner, and so we're hoping that these faster build machines will also improve our wait time situation (but see below). Currently we're limited to running the build on these machines with -j1 because of random hangs in the build when using -j2 or higher (bug 524149). Once we fix that, or move to pymake, we should see even better improvements.

What about OSX?

In preparation for deploying these new hardware build machines, we also implemented some prioritization algorithms to choose fast build machines over slow ones, and also to try and choose a machine that has a recent object directory (to make our incremental builds faster). This has helped us out quite a bit on our OSX end-to-end times as well, where we have a mixed pool of xserves and minis doing builds and tests. OSX End to End time Simply selecting the right machine for the job reduced our end-to-end time from 3h12 to 2h13, again almost an hour improvement, or 30% better.

What's next?

We have 25 linux machines that should be coming into our production pools this week. We'll continue to monitor the end-to-end and wait times over the next weeks to see how everything is behaving. One thing I'm watching out for is that having faster builds means we can produce more builds in less time...which means more builds to test! Without enough machines running tests, we may end up making wait times and therefore our end-to-end times worse! We're already begun work on handling this. Our plan is to start doing the unittest runs on the talos hardware....but that's another post!
One useful script, a linux version

Johnathan posted links to 3 scripts he finds useful. His sattap script looked handy, so I hacked it up for linux. Run it to do a screen capture, and upload the image to a website you have ssh access into. The link is printed out, and put into the clipboard. Hope you find this useful!


#!/bin/sh

# sattap - Send a thing to a place

set -e


SCP_USER='catlee'

SCP_HOST='people.mozilla.org'

SCP_PATH='~/public_html/sattap/'


HTTP_URL="http://people.mozilla.org/~catlee/sattap/"


FILENAME=`date | md5sum | head -c 8`.png

FILEPATH=/tmp/$FILENAME


echo Capturing...

import $FILEPATH

echo Copying to $SCP_HOST

scp $FILEPATH ${SCP_USER}@${SCP_HOST}:$SCP_PATH

echo Deleting local copy

rm $FILEPATH


echo $HTTP_URL$FILENAME | xclip -selection clipboard

echo Your file should be at $HTTP_URL$FILENAME, which is also in your paste buffer

What happens when you push

As of November 1st, when you push a change to mozilla-central, the following builds and tests get triggered:

  • Linux optimized build
    • mochitest 1/5
    • mochitest 2/5
    • mochitest 3/5
    • mochitest 4/5
    • mochitest 5/5
    • everythingelse
    • Talos
    • Talos nochrome
    • Talos jss
    • Talos dirty
    • Talos tp4
    • Talos cold
  • Linux debug build + leak tests
    • mochitest 1/5
    • mochitest 2/5
    • mochitest 3/5
    • mochitest 4/5
    • mochitest 5/5
    • everythingelse
  • Linux optimized + refcounting build
    • mochitest 1/5
    • mochitest 2/5
    • mochitest 3/5
    • mochitest 4/5
    • mochitest 5/5
    • everythingelse
  • Windows optimized build
    • mochitest 1/5
    • mochitest 2/5
    • mochitest 3/5
    • mochitest 4/5
    • mochitest 5/5
    • everythingelse
    • XP Talos
    • XP Talos nochrome
    • XP Talos jss
    • XP Talos dirty
    • XP Talos tp4
    • Vista Talos
    • Vista Talos nochrome
    • Vista Talos jss
    • Vista Talos dirty
    • Vista Talos tp4
  • Windows debug build + leak tests
    • mochitest 1/5
    • mochitest 2/5
    • mochitest 3/5
    • mochitest 4/5
    • mochitest 5/5
    • everythingelse
  • Windows optimized + refcounting build
    • mochitest 1/5
    • mochitest 2/5
    • mochitest 3/5
    • mochitest 4/5
    • mochitest 5/5
    • everythingelse
  • Mac OSX optimized build
    • mochitest 1/5
    • mochitest 2/5
    • mochitest 3/5
    • mochitest 4/5
    • mochitest 5/5
    • everythingelse
    • Leopard Talos
    • Leopard Talos nochrome
    • Leopard Talos jss
    • Leopard Talos dirty
    • Leopard Talos tp4
    • Leopard Talos cold
  • Mac OSX debug build + leak tests
    • mochitest 1/5
    • mochitest 2/5
    • mochitest 3/5
    • mochitest 4/5
    • mochitest 5/5
    • everythingelse
  • Mac OSX optimized + refcounting build
    • mochitest 1/5
    • mochitest 2/5
    • mochitest 3/5
    • mochitest 4/5
    • mochitest 5/5
    • everythingelse
  • Linux 64-bit build
  • Maemo Build
    • mochitest chrome
    • crashtest
    • mochitest 1/4
    • mochitest 2/4
    • mochitest 3/4
    • mochitest 4/4
    • reftest
    • xpcshell
    • Talos Tdhtml
    • Talos Tgfx
    • Talos Tp3
    • Talos Tp4
    • Talos Tp4 nochrome
    • Talos Ts
    • Talos Tsspider
    • Talos Tsvg
    • Talos Twinopen
    • Talos non-Tp1
    • Talos non-Tp2
  • WinCE build
  • Windows Mobile build
  • Linux Fennec Desktop build
  • Windows Fennec Desktop build
  • Mac OSX Fennec Desktop build
That's 111 distinct build and test jobs that get spread out across our build and tests pools. A total of 40 machine hours per checkin in our main build, test and talos pools is used, plus an additional 25 machine hours on the mobile devices!!! In addition, we also do certain types of jobs on a periodic basis:
  • Nightly builds
  • XULRunner builds
  • Shark builds
  • Code coverage runs
  • L10n repacks for 72 locales and 7 platforms (Windows, Mac OSX, Linux, Windows Fennec, Mac OSX Fennec, Linux Fennec, Maemo); that's 504 individual repacks!
In the course of collecting the data for this post, I've been constantly amazed at the amount of stuff that we're doing, and the scale of the infrastructure! The list above is just for our mozilla-central branch, and I've most likely missed something. We do similar amounts of work for our other branches as well: Try, mozilla-1.9.2, mozilla-1.9.1, TraceMonkey, Electrolysis, and Places. Things have certainly changed a lot in the past year.

When do tests get run?

Continuing our RelEng Blogging Blitz, I'm going to be discussing how and when tests get triggered in our build automation systems. We've got two basic classes of tests right now: unit tests, and performance tests, a.k.a. Talos. The unit tests are run on the same pool of machines that the builds are done on, while the performance tests are run on a separate pool of around 100 Mac Minis. Both kinds of tests are triggered in similar ways. For refcounting ("unittest") builds, once the compile step is complete, the binaries are packaged up with make package, the tests are packaged up with make package-tests, the symbols are packaged up with make buildsymbols, and then the whole lot is uploaded to stage.mozilla.org using make upload. Once they're uploaded, we have valid URLs that refer to the builds, tests, and symbols. We then trigger the relevant unit test runs on that build. When a slave is assigned this test run, it then downloads the build, tests, and symbols from stage and starts running the tests. On mozilla-central, we've also recently started to run unittests on optimized and debug builds. We're hoping to bring this functionality to mozilla-1.9.2 once all the kinks are worked out. For regular optimized builds, in addition to unittests, we also trigger performance tests on the freshly minted build. OSX builds are currently tested on Tiger and Leopard for mozilla-1.9.1 and mozilla-1.9.2, and on Leopard only for mozilla-central and project branches. Windows builds are tested on XP and Vista, and Linux builds are tested on Ubuntu. In addition to having tests triggered automatically by builds, the Release Engineering Sheriff can re-run unittests or performance tests on request!