Pull Diagnostic Support for Neovim
I've used vim as my primary text / code editing tool for...literally decades. A few years ago, I tried out neovim, hoping to take advantage of more advanced developer oriented features like treesitter and native LSP support.
At Shopify, I do a lot of work in Ruby. Our incredible developer experience team maintain ruby-lsp, a language server for the Ruby language.
Of course, I wanted to make sure that using it in neovim was a great experience!
LSPs can do many things: auto completion, enabling jumping to function or type definitions, showing function documentation, code formatting, and displaying code linting results.
In this particular instance, I wanted to take advantage of ruby-lsp's "diagnostics" support, which provides real-time feedback about syntax or linting errors (via rubocop)
For example:
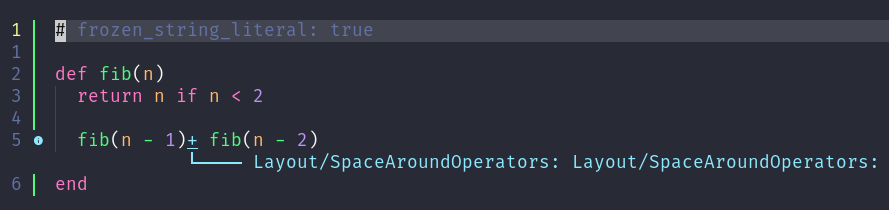
brief aside: I find the nomenclature here is a bit awkward. LSP is an abbreviation for "Language Server Protocol". neovim implements a client which implements the LSP, which connects to one or more servers with also implement the protocol. Commonly a server which implements the LSP protocol is referred to as an "LSP server" or "LSP." I'll do that here.
Push vs pull
Unfortunately for me, neovim before 0.10 only supports "push" diagnostics, and ruby-lsp only supports "pull" diagnostics.
"Push" diagnostics are where the LSP pushes diagnostic information about your source code to the client (neovim in this case). The challenge with push diagnostics is that it's difficult for the LSP to know when to generate and send the diagnostics. It has no way to coordinate with other LSPs, and doesn't really how the user is interacting with the editor, aside from receiving events when the sourcecode has been changed. This becomes a problem when many changes to a file are made; how does the LSP know when to generate and push the diagnostics? Should it do it on every change? Wait for a bit after the last change is made?
These challenges are why the language server protocol was updated to add support for "pull" diagnostics. In this model the client (neovim) requests diagnostics from the LSP server, which is much more efficient since the client (neovim) can make much better decisions about when to perform sourcecode diagnostics.
more technically, "push" diagnostics are implemented via the textDocument/publishDiagnostics method. "pull" diagnostics are implemented via the textDocument/diagnostic method
Pull support in neovim (open-source FTW!)
Last year I spent some time adding support for pull diagnostics to neovim 0.10. I learned a lot about neovim, LSP, and lua in the process!
To me, this really highlights the benefits of open-source: there was something in my toolbox that I wasn't happy with, and I am empowered (and encouraged!) to contribute and make it better for everyone! Of course, I relied heavily on more experienced contributors to the project, and, of course, my initial implementation required some follow-ups.
My first neovim plugin
However, neovim 0.10 hasn't been released yet, and so I also wanted to make sure that I could use ruby-lsp with stable (0.9.x) versions of neovim.
So I created my very first neovim plugin: https://github.com/catlee/pull_diags.nvim. This enables "pull" diagnostics for neovim prior to 0.10. It's not quite as efficient as the support built into 0.10, but it works for my day to day development. If it doesn't work for you, please let me know!
Installing it is quite simple; for example, with Lazy.nvim:
{
  "catlee/pull_diags.nvim",
  event = "LspAttach",
  opts = {},
}
Final thoughts

As a professional software engineer, I think it's important to invest in the tools that I use to get my work done. Concretely, this means that I need (and want!) to spend time learning what new tools and techniques are out there now, and to make sure to sharpen my tools.
In this case, I wanted to take advantage of a new technology (LSP & ruby-lsp) in my editor of choice (neovim). Since these tools are all open-source, I'm empowered to change them to fit my needs.
In other words, as professionals, we shouldn't accept drawbacks or limitations in our tools: we should fix them! It's just another piece of software after all!

 Our end goal is to run unittests on our optimized and debug builds. We would stop doing our current reference counting builds, since the debug builds also have reference counting enabled.
 To get there requires a few intermediate steps: